Your email address will not be published. Required fields are marked *
Our expert reaches out shortly after receiving your request and analyzing your requirements.
If needed, we sign an NDA to protect your privacy.
We request additional information to better understand and analyze your project.
We schedule a call to discuss your project, goals. and priorities, and provide preliminary feedback.
If you're satisfied, we finalize the agreement and start your project.
Transform complex data into actionable insights with advanced data visualization and enterprise reporting solutions that drive informed decision-making.
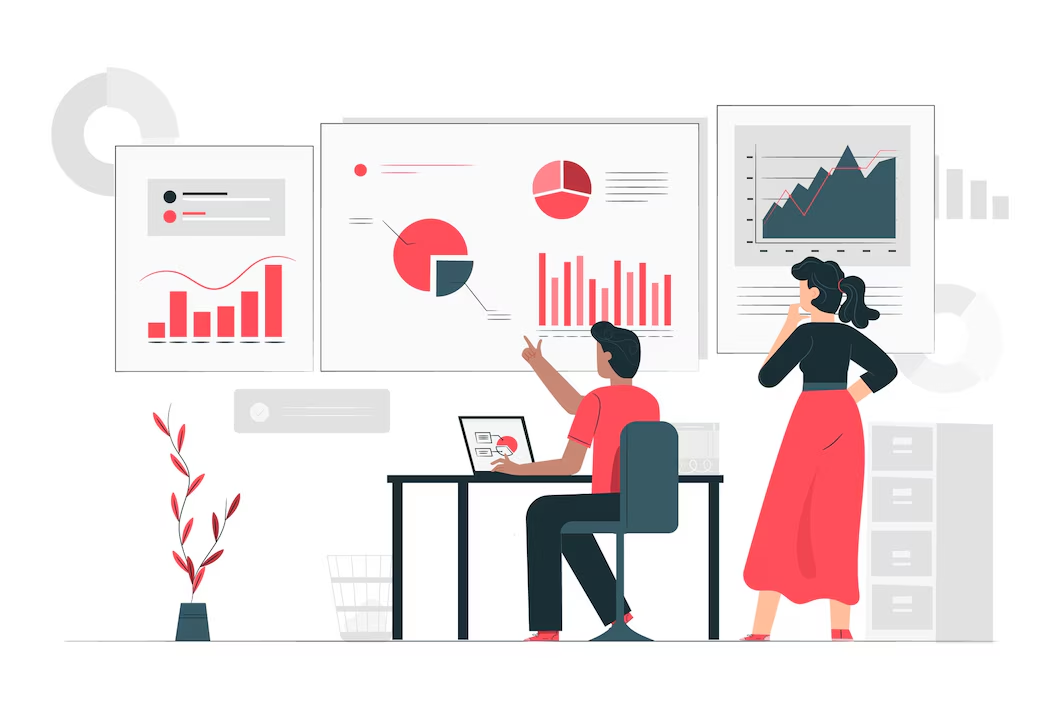


Our Data Visualization & Enterprise Reporting Services transform complex data into actionable insights, enabling informed decision-making and business growth.
Create dashboards that provide a comprehensive view of critical business metrics in one place.User-friendly and interactive dashboards to help stakeholders monitor and manage performance efficiently.
Eliminate manual data collection and reporting with automated services.Streamline the reporting process to save time and reduce errors.Automatically generated reports keep your team informed with the most up-to-date data.
Design visualizations that convey key trends and insights.Enable businesses to understand the narrative behind the data, making it more impactful.
Help businesses choose the most suitable BI tools (Tableau, Power BI, Qlik, etc.).Guide through tool implementation and provide ongoing support for maximum data utilization.
Design dashboards for real-time tracking of KPIs and other important metrics.Enable businesses to stay agile and respond quickly to changes in performance.
Our approach to healthcare app development emphasizes designing personalized user experiences and delivering efficient solutions. We cultivate transparent and dependable partnerships to develop innovative and effective app tailored to the specific needs of the healthcare industry.

Our custom healthcare app solutions allow clients to deliver effective, improved & secure care while also being compliant with strict industry’s standards like HIPAA regulation
Proven expertise in delivering top-tier solutions.
Specializing in HIPAA-compliant software.
Strict adherence to healthcare regulations.
Known for innovation, reliability, and client satisfaction.
Serving small practices to large hospitals worldwide.
Our commitment to HIPAA and GDPR standards guarantees data protection and patient privacy while maintaining total operational compliance.
Our technology stack provides the foundation to create healthcare solutions that guarantee security, speed and interoperability while maintaining innovation for the future.
✔ Agile & User-Centric – Accelerated MVP development for faster market entry.
✔ Shortest Time-to-Market – Our TURBO framework ensures speed & efficiency.


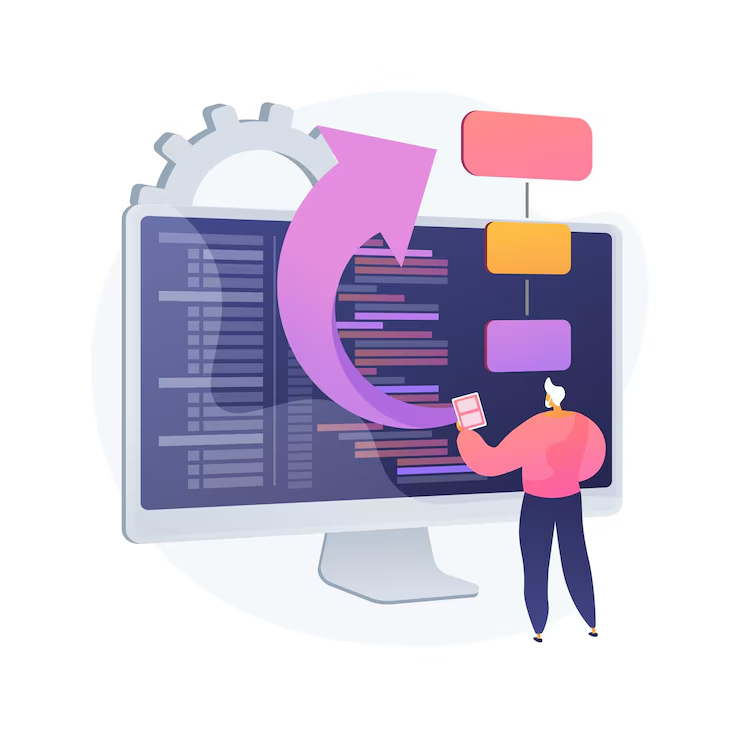
Software needs must be collected and assessed to generate an accurate SRS.
Refine feedback and finalize design procedures before creating the development roadmap.
Develop the solution using UI/UX design principles while maintaining security measures and performing compliance and performance testing.
Beta launch followed by a live release.
The maintenance and support phase involves round-the-clock monitoring of systems, analysis of client feedback, and ongoing improvements.
As a leading provider in healthcare software development, we are dedicated to crafting robust solutions that enhance efficiency and elevate patient care across various sectors, including:
Here you’ll find answers to common questions about our Data Visualization & Enterprise Reporting
Data visualization and enterprise reporting solutions enable businesses to present complex data in an easily understandable format, using dashboards, charts, and reports to provide actionable insights and support informed decision-making.
Data visualization helps stakeholders quickly identify trends, outliers, and patterns in data by presenting information visually, making it easier to understand and act on insights for better business decisions.
Real-time reporting provides up-to-the-minute data and insights, allowing businesses to make decisions based on the most current information available, improving responsiveness and agility in fast-moving environments.
Yes, self-service analytics tools allow non-technical users to generate reports and visualizations, enabling broader access to data insights across the organization without relying on technical teams.
Data governance ensures that data used in reports is accurate, consistent, and compliant with regulations, while security measures protect sensitive information from unauthorized access, ensuring trustworthy insights and compliance with industry standards.